半径から楕円のグラフを表示するPythonコード
楕円の縦軸半径と横軸半径の長さから, 楕円のグラフをPythonで表示してみよう。
楕円のグラフ(半径)
横方向の半径の長さを $a$, 縦方向の半径の長さを $b$ とすると, $(x,y)=(a\cos\theta, b \sin \theta)$ が対応する(原点中心の)楕円の媒介変数表示となる。
媒介変数 $\theta$ をlinspace(0, 2*np.pi, n) で $0 \leqq \theta \leqq 2\pi$ の中で $n$ 刻みで定義する。
x 座標をa*np.cos(theta), y 座標をb*np.sin(theta)として, matplotlib.pyplot(x, y)でグラフを表示する。
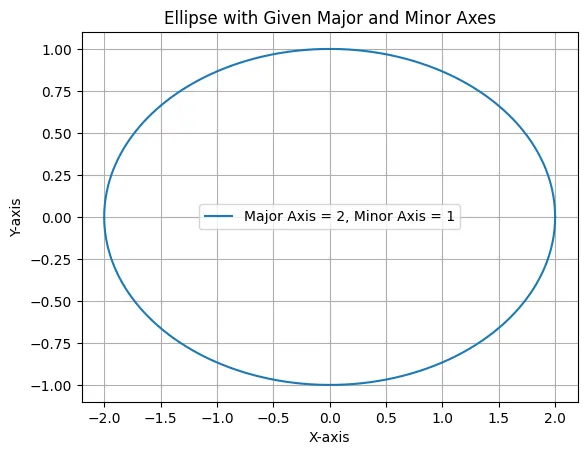
入力例. 横軸半径 $a=2$ と縦軸半径 $b=1$ の楕円を表示する
import matplotlib.pyplot as plt
import numpy as np

# 長軸と短軸の長さ
a = 2
b = 1

# パラメータを生成
theta = np.linspace(0, 2 * np.pi, 1000)

# 楕円の座標計算
x = a * np.cos(theta)
y = b * np.sin(theta)

# 楕円を描画
plt.plot(x, y, label=f'Major Axis = {a}, Minor Axis = {b}')
plt.title('Ellipse with Given Major and Minor Axes')
plt.xlabel('X-axis')
plt.ylabel('Y-axis')
plt.legend()
plt.grid(True)
plt.show()